Please expand the icons below to learn about common chart patterns. More patterns can be found at www.macrograph.com

– Low made early in time frame
  • 1st hour by day
  • Mon-Tue by week
  • 1st week by month
– Closes tend to be above fair price
– Highs made late in time frame
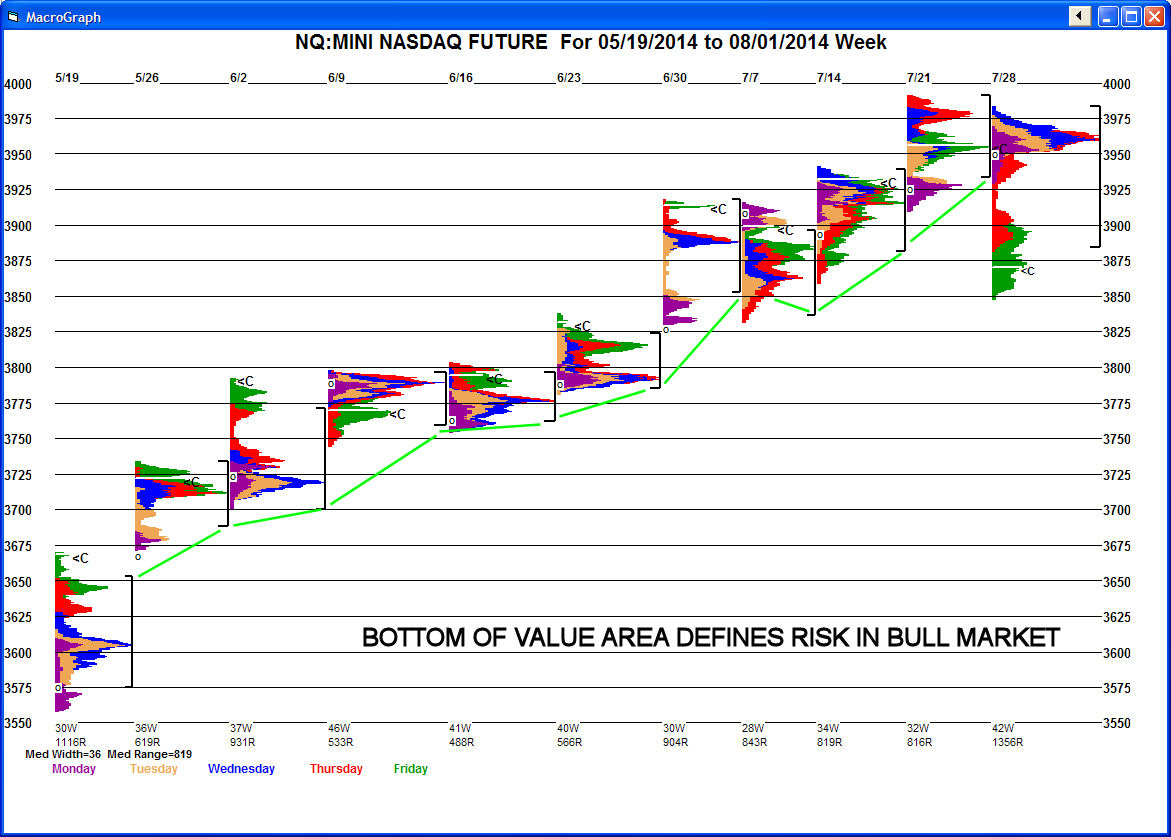
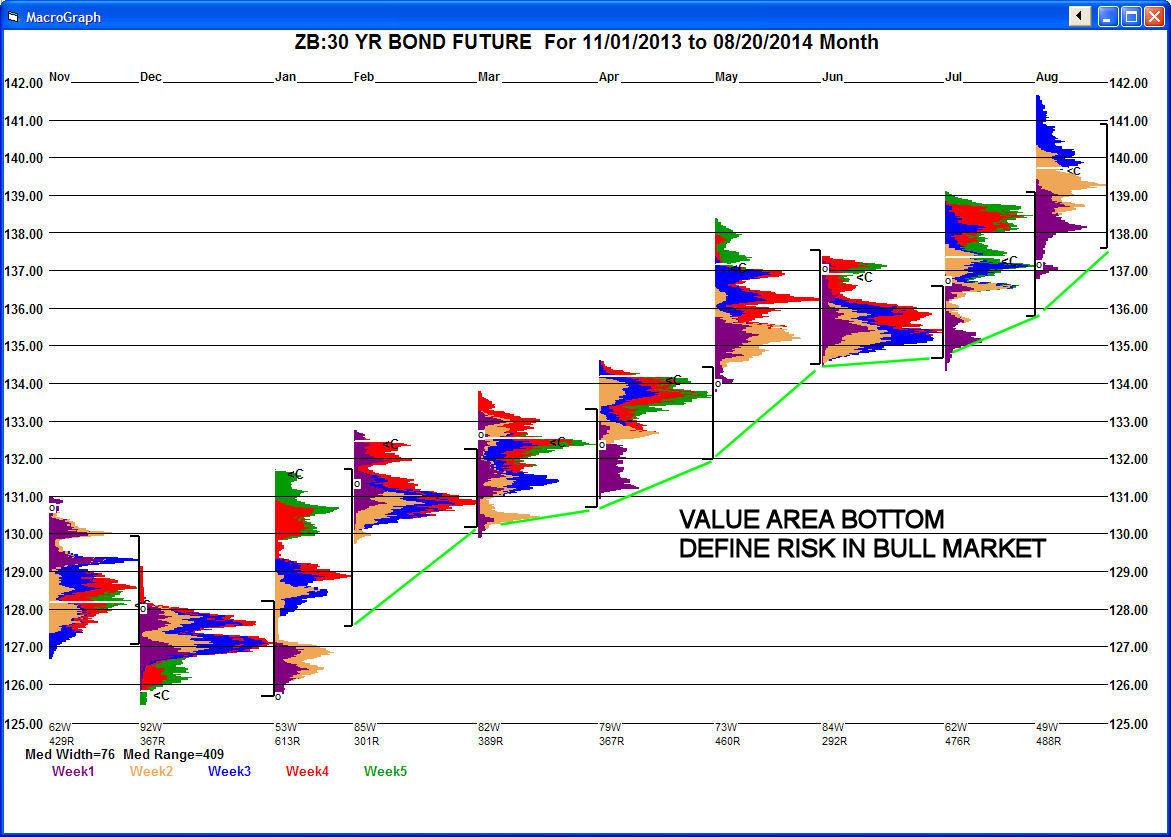
Bottoms tend to form at
  • High volume node
  • Bottom of value area
  • Single prints
– Market that exceeds normal vertical range for the time frame
  • Median ranges are displayed with each chart to judge uncharacteristic moves
  • Resting phases are normal in trends
  • Usually lasts at least 3 profiles
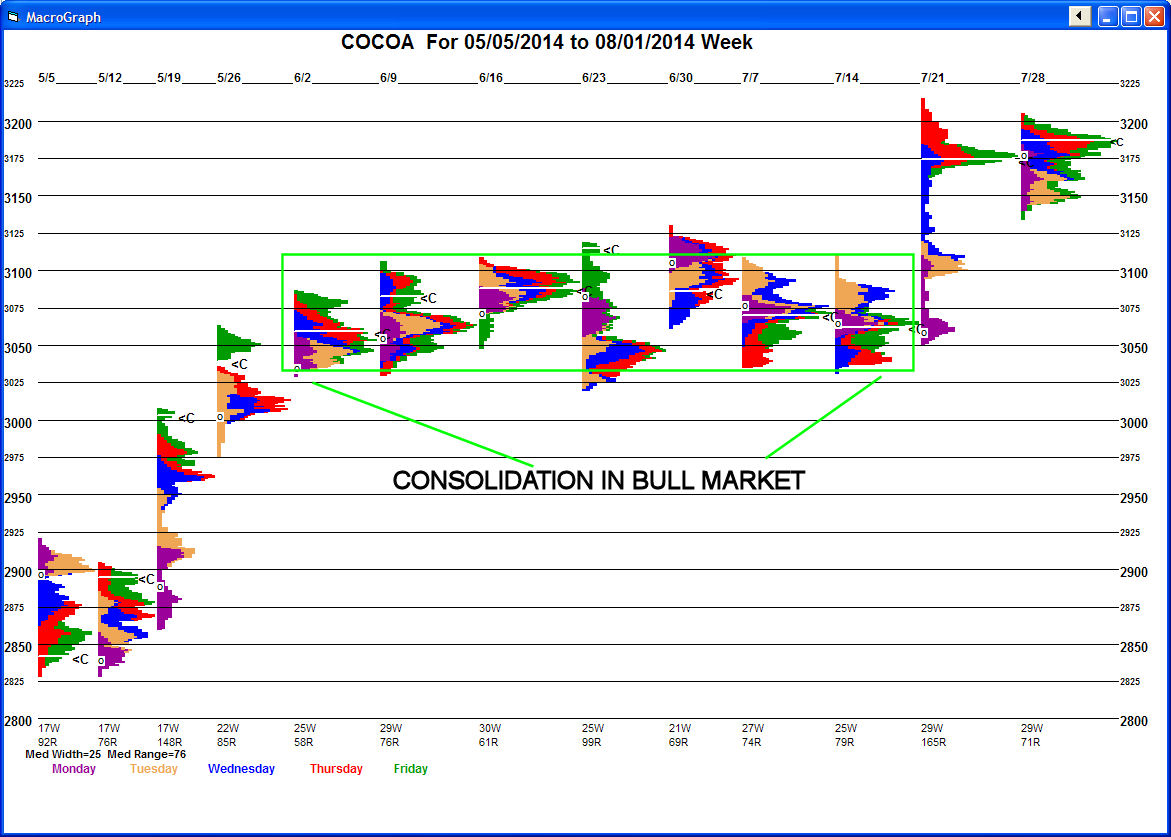
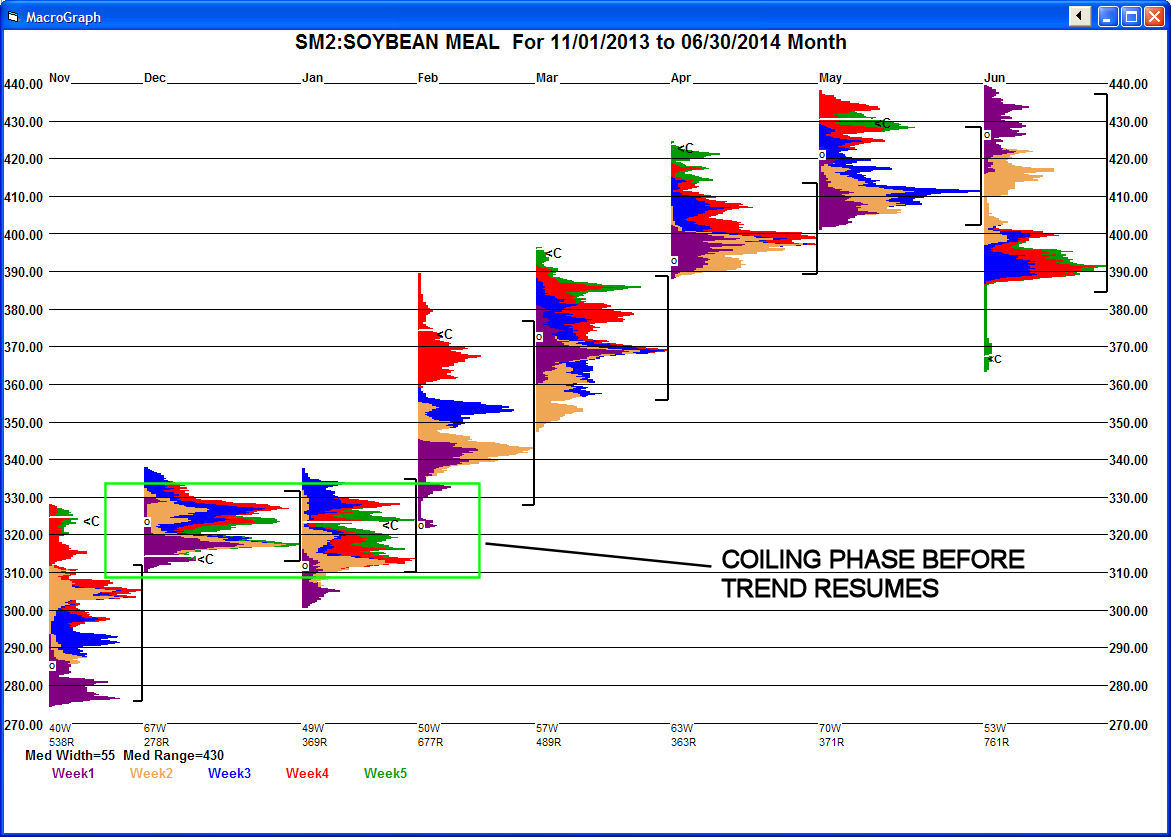
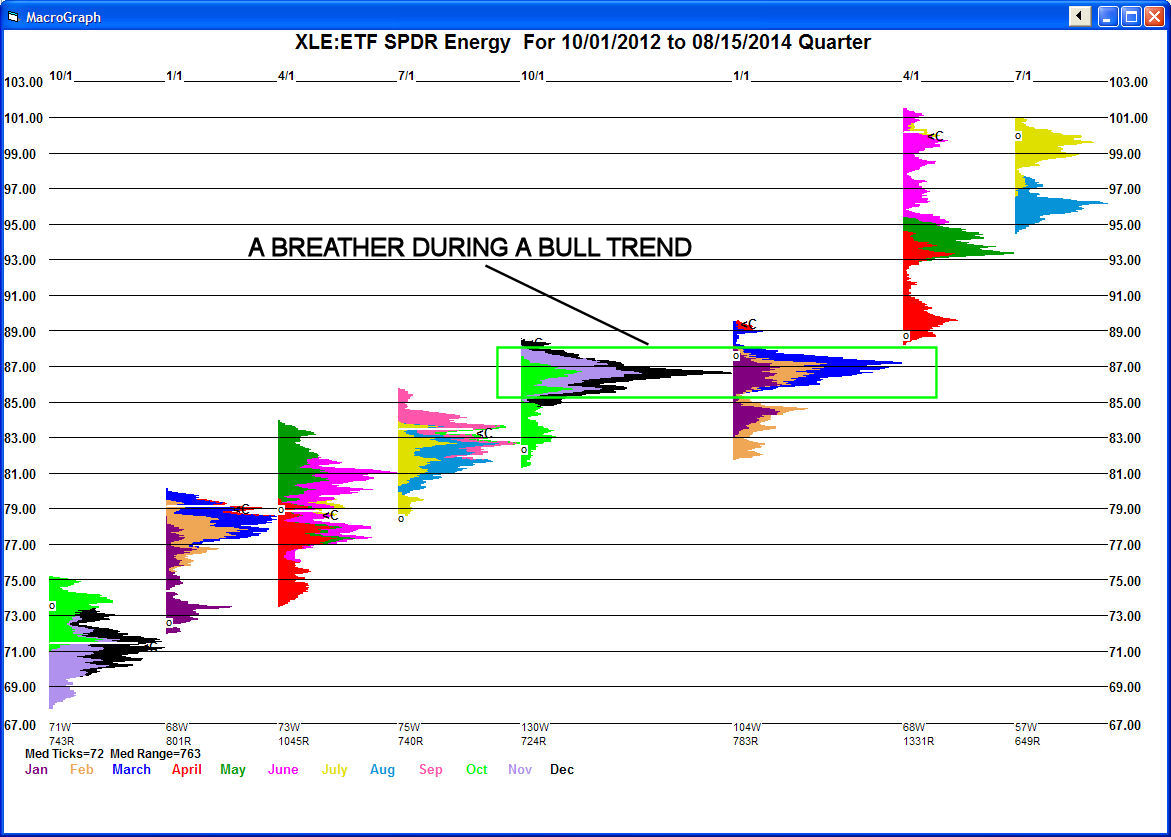
– Track value area for consolidation phase
  • Close outside value often signifies trend continuation or change
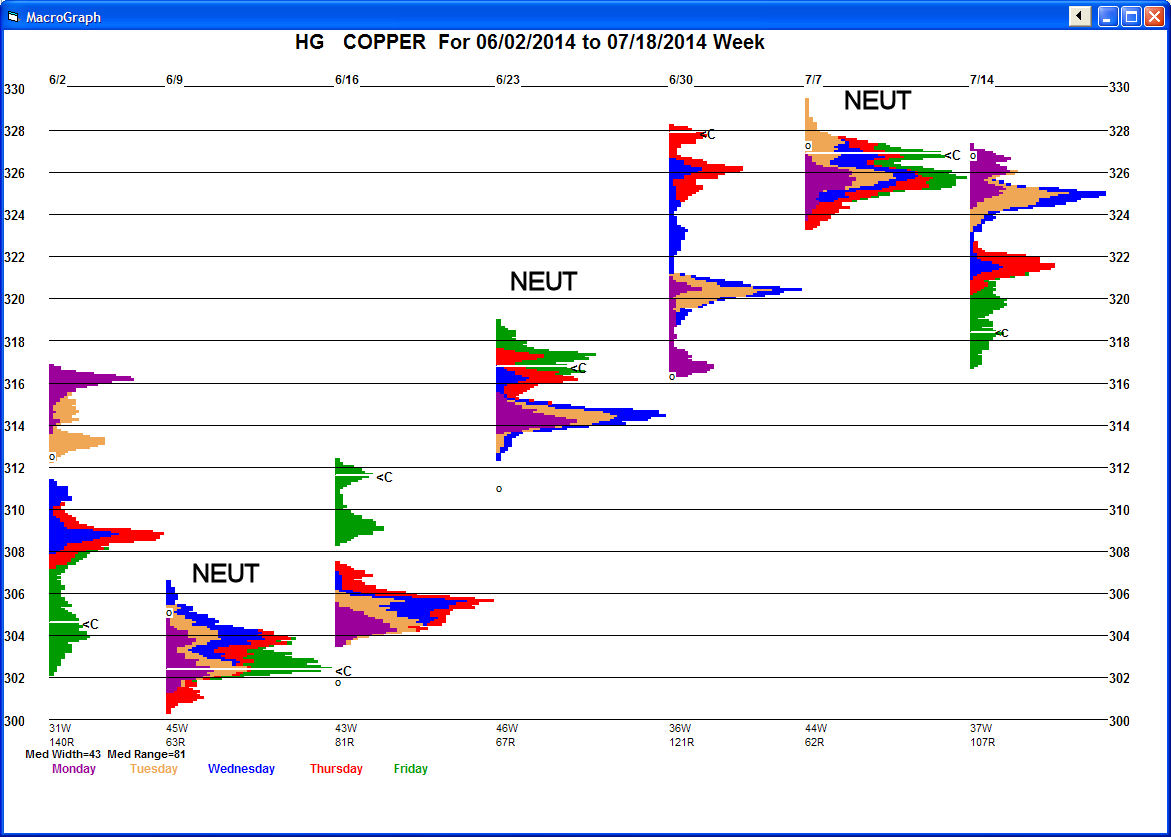
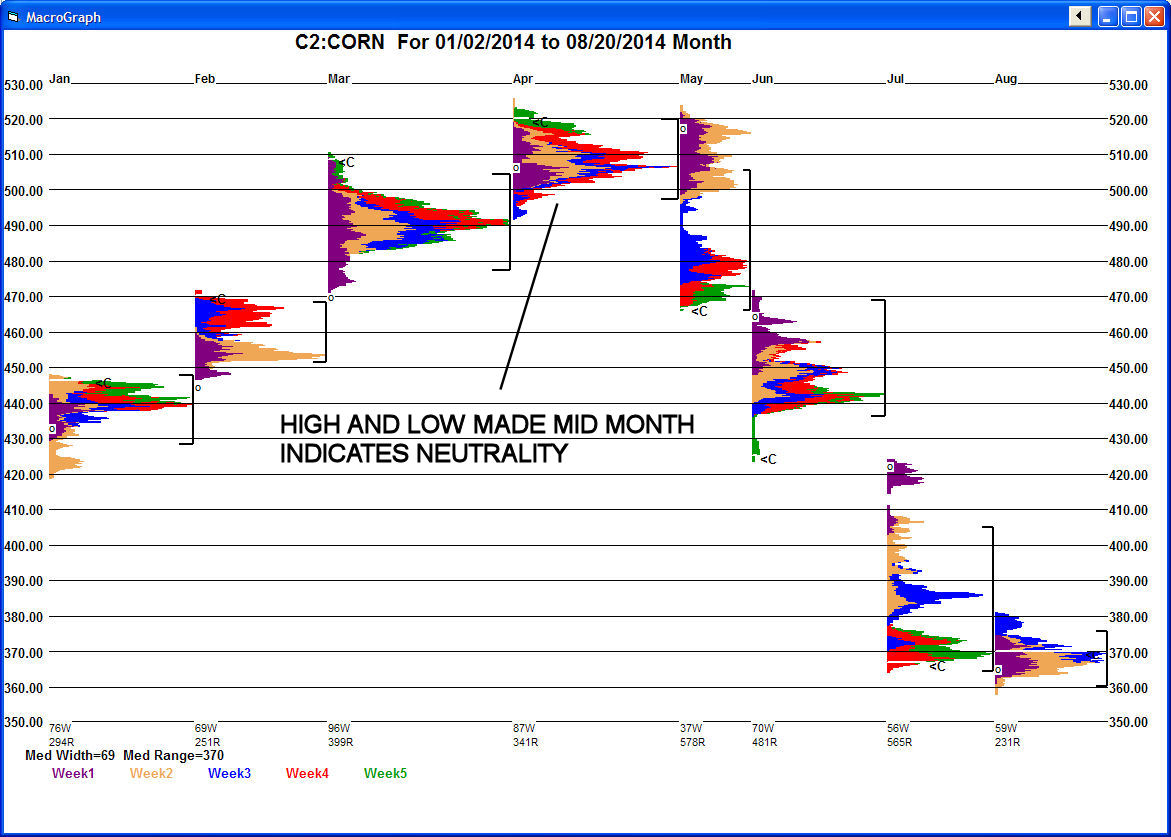
– Highs and lows made in the middle of time period
  • Color codes distinguish days, weeks and months
  • Week high and low made mid week
  • Month high and low made 2nd or 3rd week of month